Not financial advice: this post is for education and information only. Please read our full Disclaimer before acting on anything you read here.

Seven stocks gapped up and held this week — and notably, every single one moved on news, not earnings. Not one Tier 1 (earnings-driven) name passed all of our filters. One deeply oversold stock bounced 18% in a single session on a transformational data-center deal. Here’s what qualified, why it made the cut, and what to watch next.
In this post
- This week’s qualifiers
- ARM — Arm Holdings
- CRWD — CrowdStrike
- ZS — Zscaler
- INTC — Intel
- FTNT — Fortinet
- OKTA — Okta
- MU — Micron Technology
- GNRC — Generac Holdings
- Why others didn’t make the cut
- The week in markets
This week’s qualifiers
| Symbol | Company | Screen | Event day | Move | Fri close |
|---|---|---|---|---|---|
| ARM | Arm Holdings | A — gap-up | Thu 9/17 | +7.4% | $275.61 |
| CRWD | CrowdStrike | A — gap-up | Mon 9/14 | +5.9% | $237.65 |
| ZS | Zscaler | A — gap-up | Mon 9/14 | +5.0% | $197.31 |
| INTC | Intel | A — gap-up | Wed 9/16 | +4.4% | $108.60 |
| FTNT | Fortinet | A — gap-up | Mon 9/14 | +4.0% | $169.84 |
| OKTA | Okta | A — gap-up | Mon 9/14 | +3.8% | $182.37 |
| MU | Micron Technology | A — gap-up | Thu 9/17 | +3.0% | $1,015.80 |
| GNRC | Generac Holdings | B — bounce | Thu 9/17 | +18.3% | $207.44 |
ARM — Arm Holdings
Arm Holdings designs the chip blueprints behind nearly every smartphone on the planet, licensing its instruction-set architecture to Apple, Qualcomm, and a who’s-who of silicon makers. Instead of manufacturing chips, Arm collects royalties on every chip shipped with its designs — a capital-light model investors love.
What happened
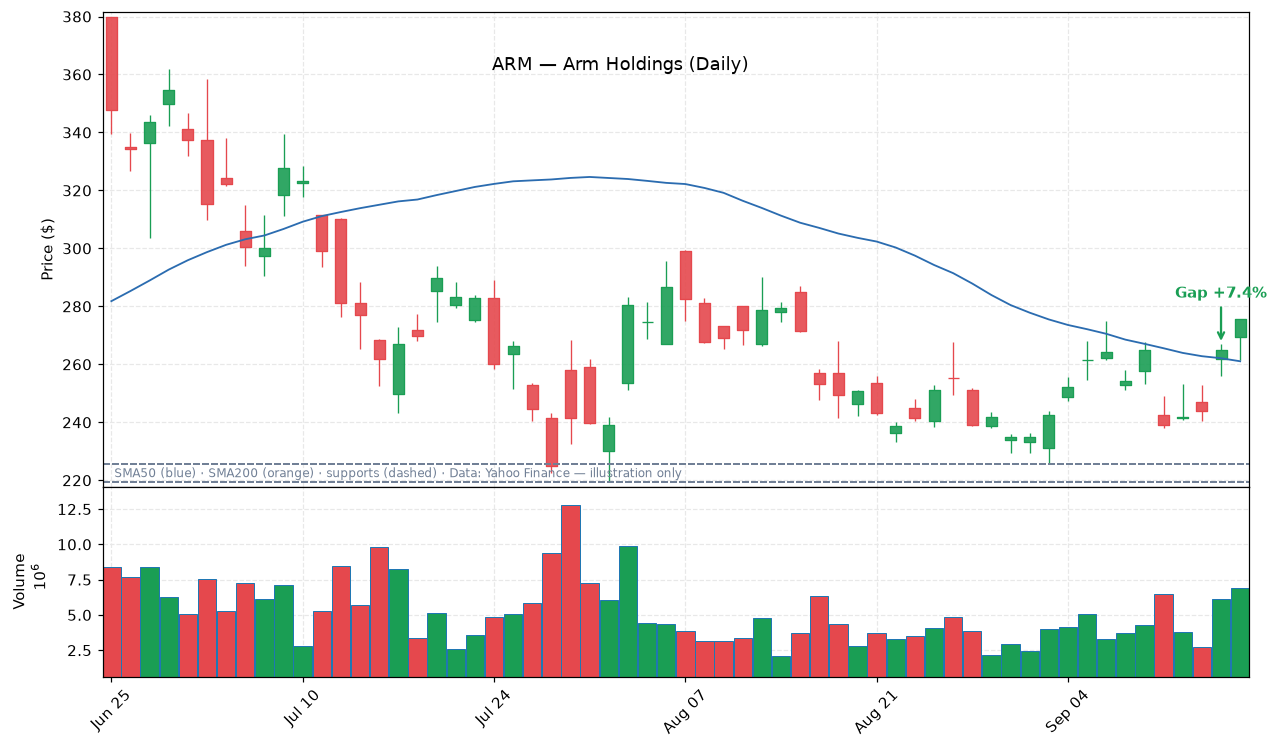
This week, ARM gapped up 7.4% at Thursday’s open, the largest gap in this week’s scan. The spark was CEO Rene Haas’s CNBC appearance on September 16, where he called AI-driven demand “off the charts.”
Haas also floated a roughly $2 billion revenue target tied to CPUs for AGI (artificial general intelligence) workloads — a number that got growth investors’ attention. For beginners: a “gap up” means the stock opened sharply higher than the prior day’s close, usually because news broke overnight.
The numbers
- What matters is whether the gap holds — and ARM did, closing Friday at $275.61, up 4.1% on the week with the gains intact.
- Technically, the stock sits 33% above its 200-day moving average and 5.6% above its 50-day, keeping the long-term uptrend intact.
- The 14-day RSI finished the week at 57.7 — firmly bullish but not yet overbought (readings above 70 typically signal overheating).
- The chart shows the gap-up candle launching from the $240–260 support zone, with volume running 1.6× average — genuine institutional buying, not a thin-market spike.
What to watch
The risk from here is valuation: at a ~$294 billion market cap, expectations are sky-high, and any wobble in AI capex spending could hit the stock hard. Watch whether ARM can hold above the gap-day low — if it slips back to fill the gap, momentum traders will likely step aside.
CRWD — CrowdStrike
CrowdStrike is the cybersecurity company behind the Falcon platform, which protects millions of corporate laptops, servers, and cloud workloads from hackers. Cybersecurity is considered “mission-critical” software — companies rarely cancel it even in downturns, which is why investors pay premium multiples.
What happened
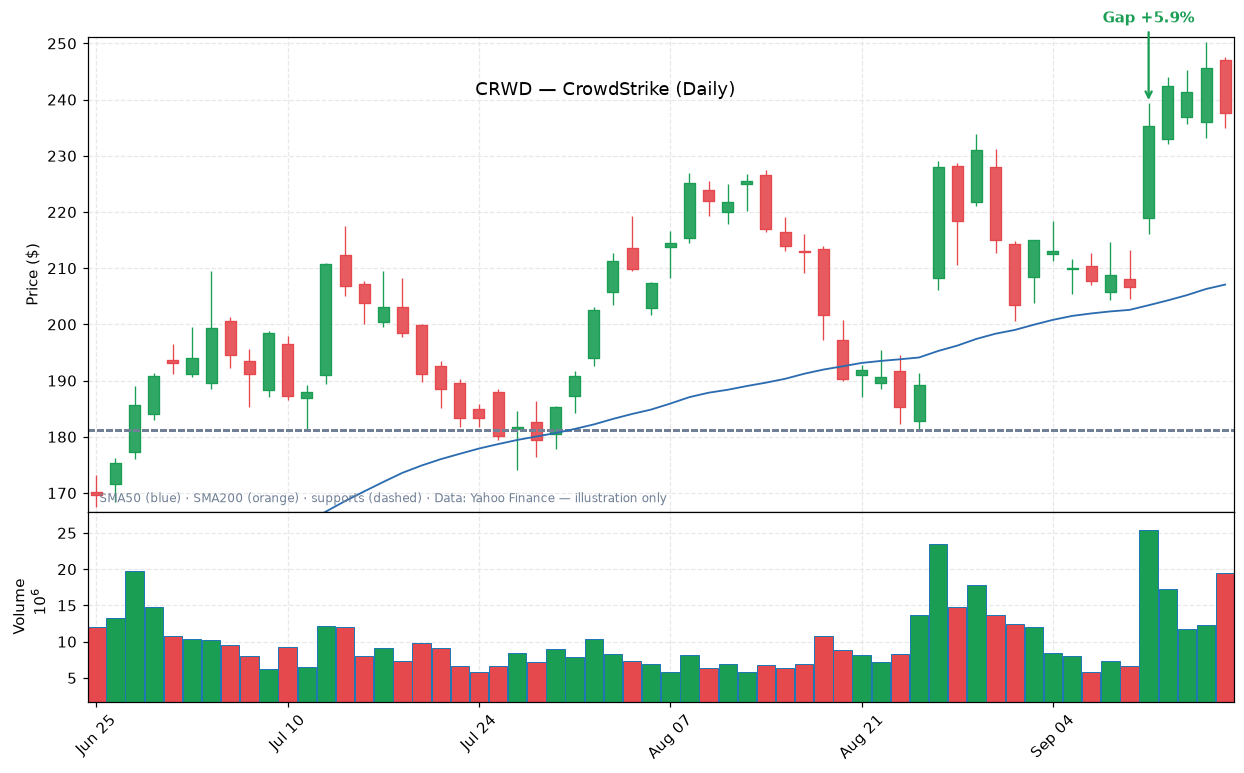
CRWD gapped up 5.9% at Monday’s open, riding a broad rotation out of semiconductors and into software security names. The trigger was a weekend essay by AI-safety researchers warning about AI risks, which spooked AI-chip stocks and sent money hunting for safer tech exposure. When semis sell off on AI fears, cybersecurity often benefits — it’s tech growth without the AI-capex question marks.
The numbers
- The stock held its gains through Friday, closing at $237.65, up nearly 15% on the week.
- With a $244 billion market cap and 12.7 million shares trading daily, this is deep institutional territory, not a retail-driven spike.
- The 14-day RSI ended at 60.4, leading most of its software peers — exactly the relative-strength behavior our screen looks for.
- Price remains 62% above the 200-day moving average, and the chart shows the bounce starting right at a rising support trendline, with gap-day volume running 2.2× average.
What to watch
One caution: the entire move is sentiment-driven rather than company-specific, so it could unwind just as fast if AI-chip fears fade. Also note CrowdStrike is still working through the reputational overhang of past outages, which can resurface on any bad headline. For the trade to keep working, CRWD needs to hold above Monday’s gap — a close back below it would signal the rotation is over.
ZS — Zscaler
Zscaler is a cloud-security company whose “zero trust” platform verifies every user and device before granting network access — no more old-style corporate VPNs. It’s one of the purest plays on the shift to cloud security, competing with Palo Alto Networks and Cloudflare.
What happened
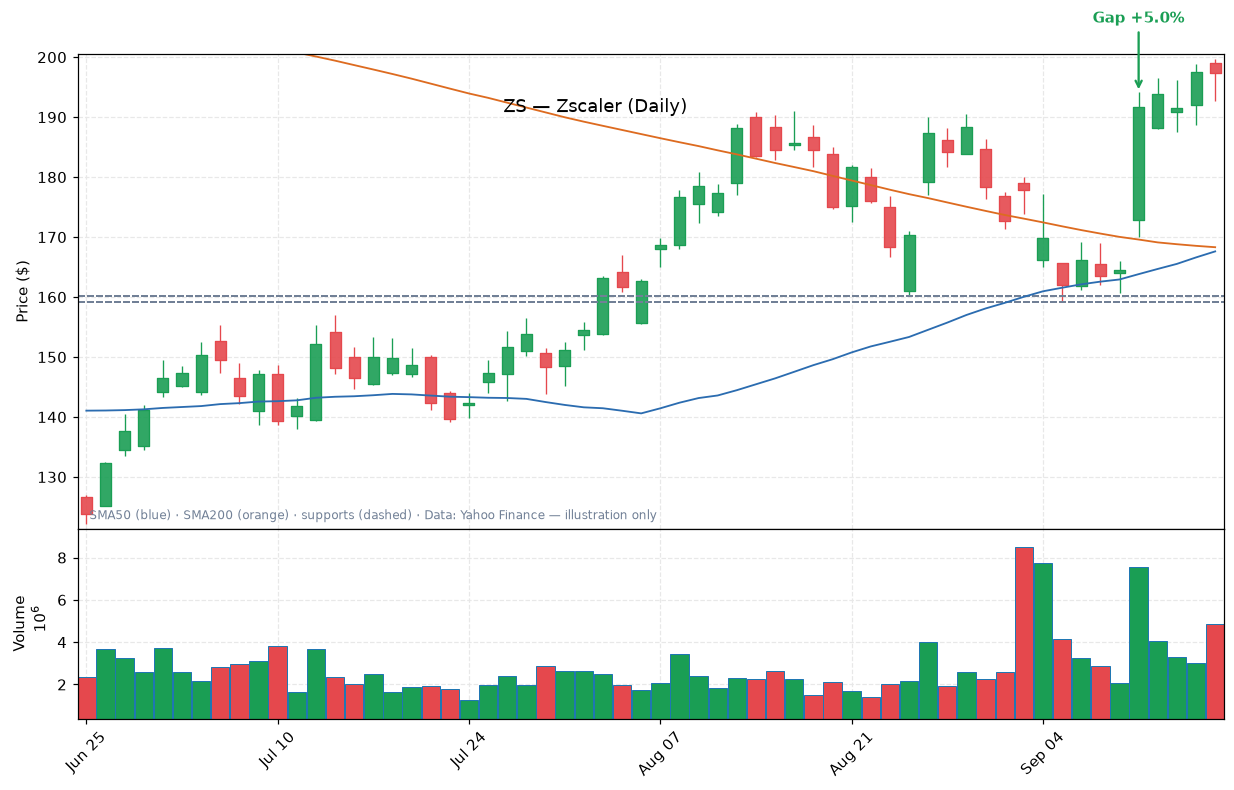
ZS gapped up 5.0% on Monday alongside CrowdStrike and Fortinet, part of the same semi-to-cyber rotation. When investors get nervous about AI hardware, they often rotate into software with recurring subscription revenue — and Zscaler fits the bill.
The numbers
- The stock held the gap into Friday’s close at $197.31, finishing the week up nearly 20%.
- At a $32 billion market cap, Zscaler is the smallest of this week’s qualifiers but still far above our $10 billion quality floor.
- Its 14-day RSI of 63.3 was the strongest in the group, signaling genuine momentum leadership, not just sympathy movement.
- The daily chart shows the stock climbing off a well-defined support zone, with the gap candle clearing short-term resistance on 2.3× average volume — clear institutional participation.
What to watch
The beginner’s lesson here: sector rotation is a powerful force — sometimes stocks move because of where money is flowing, not because of company news. The risk is mean reversion: if semiconductor stocks rebound, the money could rotate right back out of cyber. Watch the $190 area — the gap-day low — as the line in the sand for this move.
INTC — Intel
Intel needs little introduction: the pioneering American chipmaker now attempting one of the most ambitious turnarounds in tech history. Under its foundry strategy, Intel is building chip factories in the US and courting outside customers — a bet subsidized by CHIPS Act incentives.
What happened
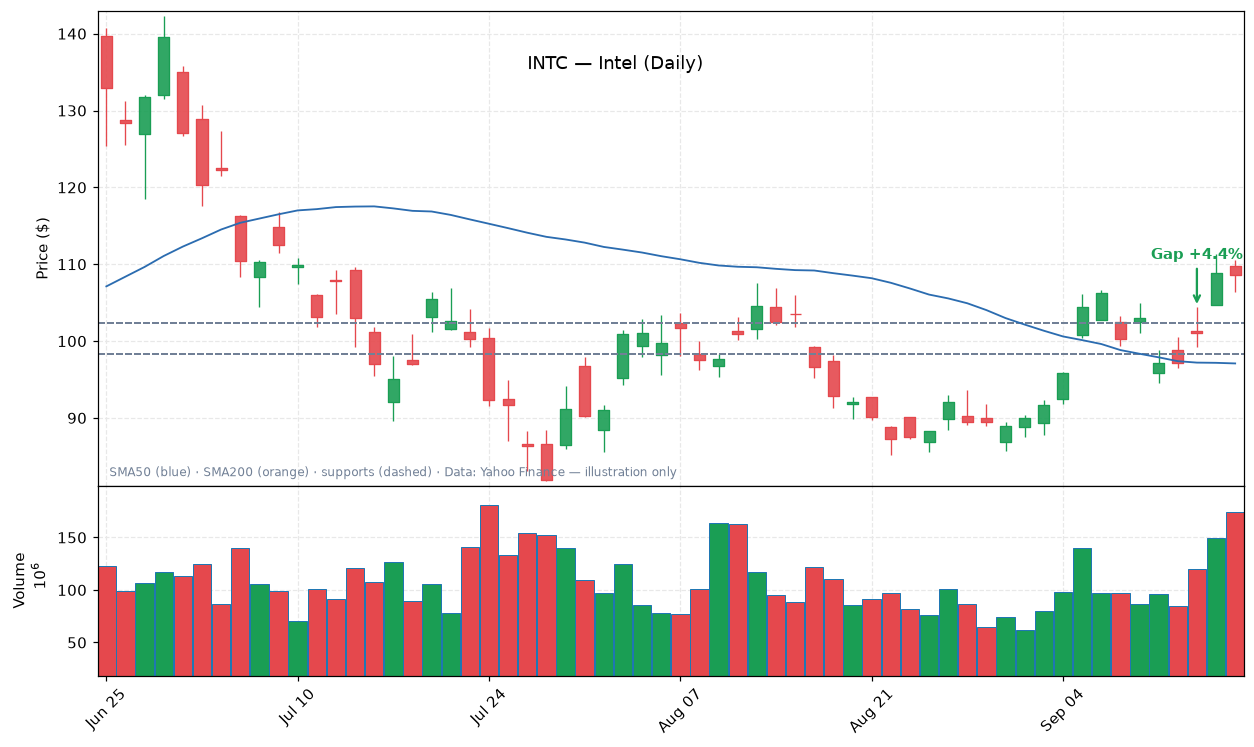
INTC gapped up 4.4% on Wednesday after Reuters reported exploratory talks with SK Hynix around Intel’s Ohio chip plant. Any credible partnership chatter matters enormously here because validating the foundry strategy is Intel’s entire investment thesis. The stock added another 3.6% on Thursday, showing real follow-through rather than a one-day wonder.
The numbers
- It closed Friday at $108.60, up 5.5% on the week, with a $571 billion market cap — by far the largest name in this week’s scan.
- Nearly 98 million shares changed hands daily on average, so liquidity is never a concern.
- The 14-day RSI finished at 61.7, leading semiconductor peers and confirming momentum, not just a dead-cat bounce.
- The chart is constructive: price holds 41% above the 200-day moving average, and the gap-up came with decisive volume expansion.
What to watch
That said, Intel has a long history of turnaround headlines that faded — investors have been burned before, so skepticism is warranted. The talks are explicitly “exploratory,” meaning there’s no deal yet, and headlines without signatures can reverse quickly.
For beginners: this is a classic “catalyst trade” — the stock moves on news about its future, and the risk is that the future doesn’t arrive. Key level to watch: the stock needs to hold above the Wednesday gap; a full retracement would suggest the market doesn’t believe the story.
FTNT — Fortinet
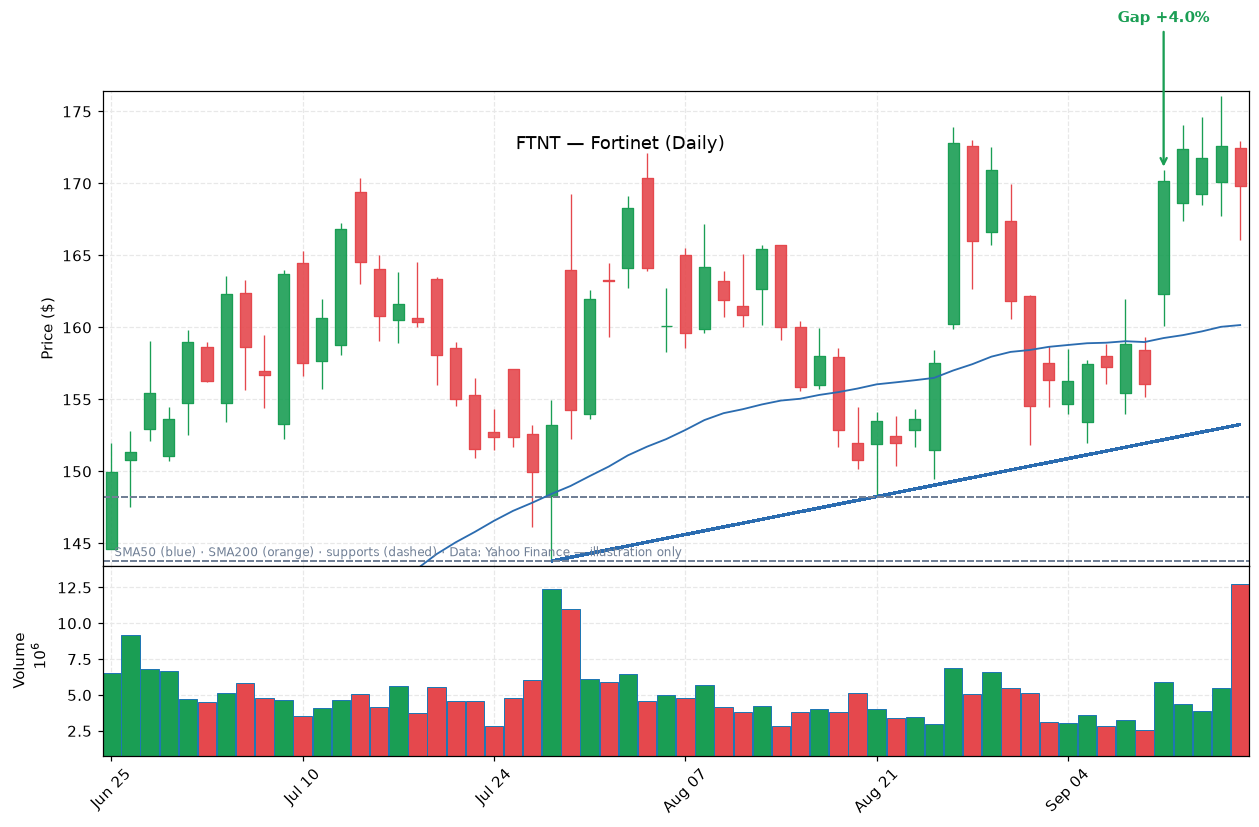
Fortinet is a cybersecurity veteran best known for its FortiGate firewalls — the hardware boxes that guard corporate networks worldwide. Unlike pure-cloud rivals, Fortinet blends hardware and software, giving it a sticky installed base of enterprise customers.
What happened
FTNT gapped up 4.0% on Monday as part of the same cyber rotation that lifted CrowdStrike, Zscaler, and Okta. Weekend AI-safety concerns hammered chip stocks, and the money flowed into dependable security software names.
The numbers
- The stock held its gains through the week, closing Friday at $169.84, up 8.8% on the week.
- With a $125 billion market cap, Fortinet is one of the anchors of the cybersecurity sector.
- Its 14-day RSI of 58.0 shows solid momentum without overheating — a healthy configuration for a continued advance.
- The chart shows price basing above a rising support line, with Monday’s gap candle breaking a short-term downtrend on 1.4× average volume.
What to watch
For beginners, Fortinet is a good example of a “defensive growth” stock — it grows, but its subscription-like revenue makes it less volatile than chipmakers. The main risk is the same as its peers: this was a rotation trade, and rotations can reverse when the original fear fades. If FTNT gives back the Monday gap, consider the move over and wait for the next setup.
OKTA — Okta
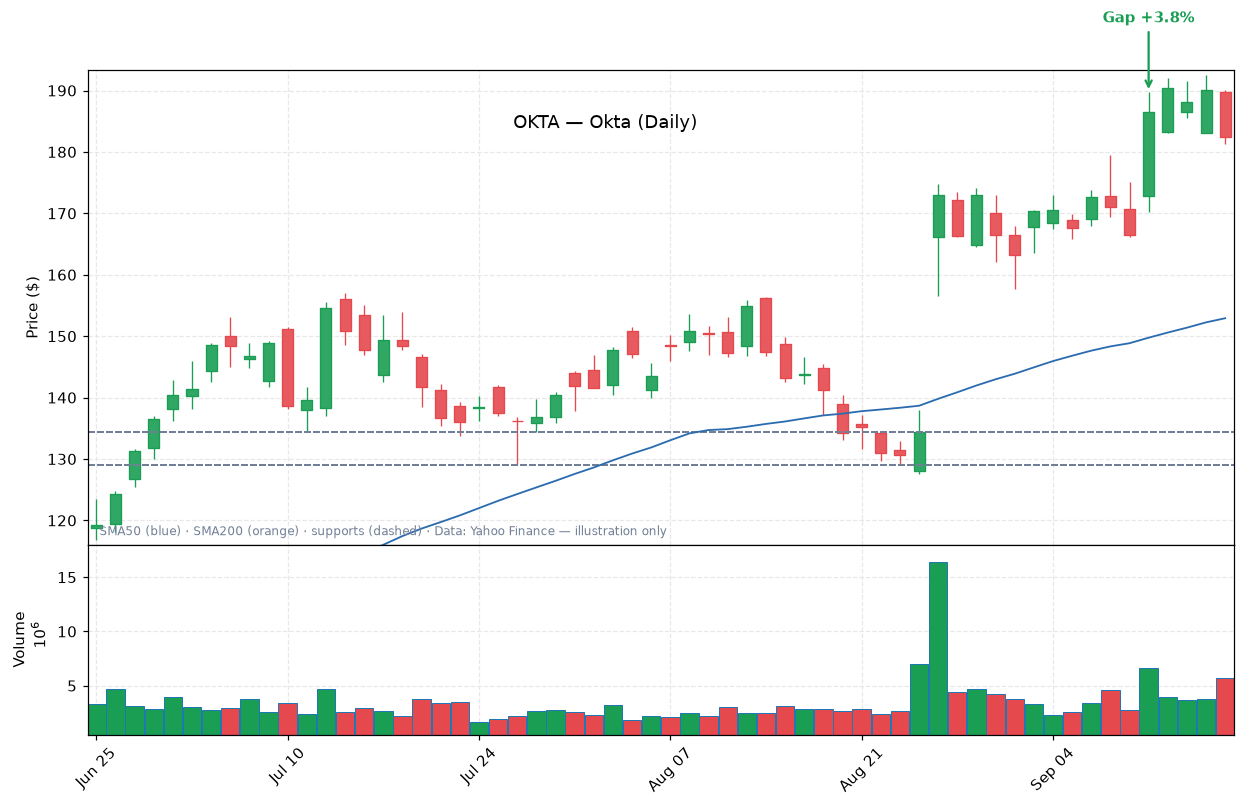
Okta is the leader in identity management — every time employees log in once and access all their work apps, there’s a good chance Okta is behind it. Identity security has become critical as hacking increasingly starts with stolen passwords rather than broken firewalls.
What happened
OKTA gapped up 3.8% on Monday, the smallest gap in this week’s scan but still above our 3% threshold. It rode the same semi-to-cyber rotation as CrowdStrike, Zscaler, and Fortinet after weekend AI-safety worries hit chip stocks.
The numbers
- The stock held the move into Friday, closing at $182.37, up 9.5% on the week.
- At a $32 billion market cap with 4.6 million shares of daily volume, it clears our quality filters comfortably.
- Its 14-day RSI of 61.5 led its peer group, which is why it qualified while some larger cyber names did not.
- The chart shows a clean launch off support, with the gap candle pushing through a declining trendline from the summer highs on 1.6× average volume.
What to watch
That’s a technically meaningful break — declining trendlines often act as ceilings until they’re cleared with volume. The catch: Okta’s growth has decelerated in recent years, so the stock needs flawless execution to justify its multiple.
Like its peers, this move is borrowed from sector rotation rather than earned by company news, so it needs confirmation. Watch the gap-day low near $175 — holding above it keeps the breakout thesis alive.
MU — Micron Technology
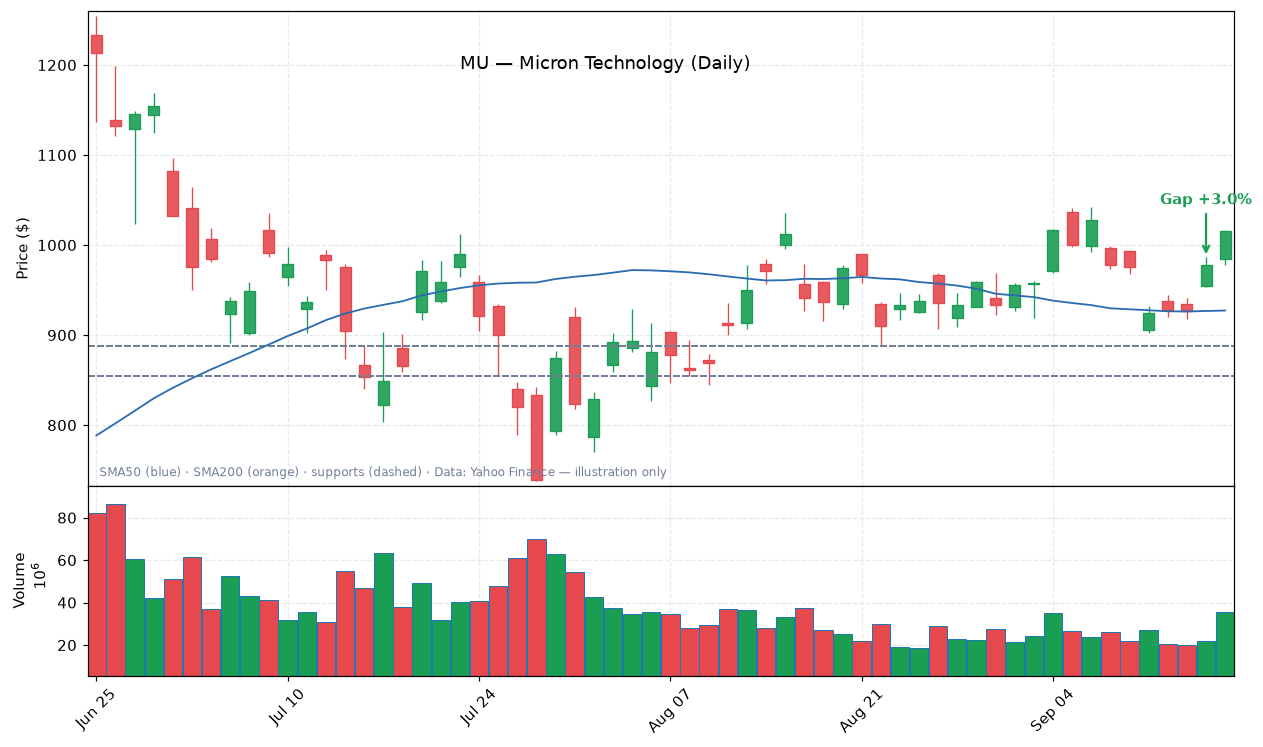
Micron Technology makes the memory chips — DRAM and NAND — that go into everything from phones to AI data centers. Memory is a notoriously cyclical industry: when demand outstrips supply, prices soar; when it doesn’t, they collapse.
What happened
Right now the cycle is favorable, and MU gapped up 3.0% at Thursday’s open. The catalyst was Intel’s CEO warning on September 15 that the memory shortage will worsen next year — music to Micron investors’ ears.
Shortages mean pricing power, and pricing power means expanding margins for memory makers. The stock also benefited from the post-Fed rebound in semiconductors on Thursday.
The numbers
- Micron closed Friday at $1,015.80, up 4.2% on the week, sporting a $1.15 trillion market cap — making it one of the largest names in the scan.
- The 14-day RSI of 58.3 shows healthy momentum without the euphoria that marks cycle tops.
- The chart is a technician’s delight: a steady rising trendline under price, with Thursday’s gap launching from support while the stock rides 59% above its 200-day average.
- Average volume of nearly 25 million shares daily means this move had the full weight of institutional money behind it.
What to watch
For beginners: cyclical stocks like Micron can be treacherous — the same shortage that drives prices up eventually invites overbuilding. The key risk is the cycle turning: memory investors must always ask “how much of the good news is already priced in?” As long as MU holds above Thursday’s gap, the bulls remain in control.
GNRC — Generac Holdings
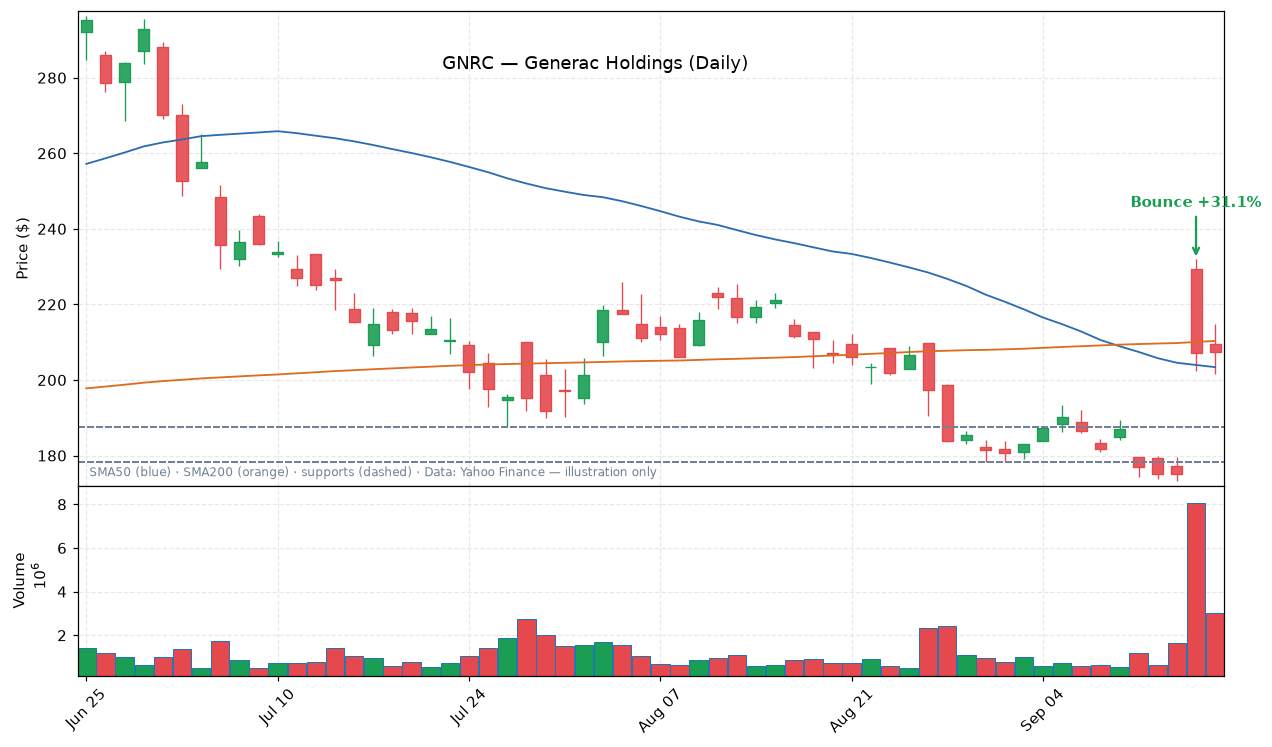
Generac Holdings is best known for home standby generators — the boxes that kick in when the power goes out. But the real growth story is commercial and industrial power, especially backup systems for data centers.
What happened
That story exploded this week: Amazon disclosed an $8 billion deal for Generac generators for its data centers on September 16. For a company of Generac’s size, an $8 billion commitment is transformational — a massive validation of the data-center power thesis.
GNRC bounced 18.3% on Thursday, qualifying for our oversold-bounce screen rather than the gap-up screen. For beginners, RSI below 30 means a stock has fallen hard and fast; bounces from those levels are often violent because sellers are exhausted.
The numbers
- Here’s why: the stock had been beaten down so badly that its 14-day RSI sat at just 32.6 the day before — deep in oversold territory.
- Thursday’s volume was 6× the average — the kind of stampede that happens when shorts scramble to cover and momentum funds pile in.
- The stock actually opened up 31% on the news before settling to an 18% gain — still a monster one-day move.
- It held those gains on Friday, closing at $207.44, which is exactly what you want to see after a euphoric open.
- The chart tells the story: a long decline into washed-out lows, then a massive bullish candle on record volume.
What to watch
The risk is obvious — chasing a stock up 18% in a day rarely ends well in the short term, and some giveback would be normal. Longer term, the question is whether the Amazon deal is a one-off or the start of a data-center ordering wave. Note that GNRC failed our gap-up screen (it closed below its 200-day average) — this is a bounce trade, not a momentum-leader setup, so size positions accordingly.
Why others didn’t make the cut
Twenty-one names were screened out this week. The most instructive:
| Name | Screen | Why it failed |
|---|---|---|
| PANW | A | Gapped +4.8% Monday, but RSI 53.1 lagged IT peers |
| NBIS | A | Gapped +9.9% Thursday, but the gap faded and RSI lagged |
| SMCI | A | The +9.5% move was Thursday — no qualifying Friday gap |
| LEN | A | Earnings miss 9/16; below 200-day, RSI 35.2, gap not held |
| NET | A | Opening gap only +2.1% — below our 3% floor |
| S (SentinelOne) | A | Market cap $7.8B — below our $10B quality floor |
| AVGO, GOOG, DELL, SNDK | A | Premarket quotes faded; official opens under 3% |
| MARA | A | Crypto miner — excluded category |
| HOOD | A | Financials — excluded sector |
| GNRC | A | Closed below 200-day SMA (qualified in Screen B instead) |
The week in markets
- Wed 9/16 — The Fed hiked 25bp to 3.75–4%, its first increase since July 2023. The dots signal one more hike in 2026; Chair Warsh cited elevated inflation. Largely priced in, but it cemented the hawkish turn. (Motley Fool)
- The 10-year Treasury closed the week around 5% — a 19-year high. The Dow fell 1.7% for a third straight weekly loss, while the S&P 500 and Nasdaq finished flat-to-up on Thursday’s tech rebound. (CNN)
- Fri 9/18 — Warren Buffett, 96, stepped down as Berkshire Hathaway chairman; son Howard succeeds him. Buffett becomes chairman emeritus, closing a 60-year leadership era; succession clarity should limit BRK volatility. (Reuters)
- Mon 9/14 — An AI-safety scare triggered a global AI-chip selloff at the open (Nasdaq futures were down ~1.6% premarket) before tech recovered — the whipsaw that set up this week’s semi-to-cyber rotation behind four of our seven qualifiers.
This post is for informational and educational purposes only — not financial advice. Read our full Disclaimer.
See you next Friday after the close.


Leave a comment