
The Relative Strength Index (RSI) is a momentum indicator that measures how fast and how far a stock’s price has been moving. It was developed by J. Welles Wilder Jr. and introduced in his 1978 book New Concepts in Technical Trading Systems. Nearly fifty years later, it’s still one of the most widely used indicators in trading.
RSI oscillates between 0 and 100. High readings mean buyers have been aggressive; low readings mean sellers have dominated. That’s it — everything else is interpretation.
How RSI Is Calculated (The Simple Version)
You don’t need the formula to use RSI, but knowing the intuition helps:
- Look at the last 14 periods (usually 14 days on a daily chart — the standard setting).
- Add up the gains on up days and the losses on down days separately.
- RSI compares the average gain to the average loss.
If the average gain dwarfs the average loss, RSI pushes toward 100. If losses dominate, it sinks toward 0. An RSI of 50 means gains and losses are roughly balanced.
The precise formula is RSI = 100 − [100 / (1 + RS)], where RS = average gain / average loss. Every charting platform — including TradingView — calculates it for you automatically.
Reading the Levels: 70, 30, and 50
The classic interpretation:
- Above 70 — “overbought.” Buying has been intense. The move may be stretched.
- Below 30 — “oversold.” Selling has been intense. The decline may be exhausted.
- 50 — the centerline. Above 50, bulls have the edge; below 50, bears do. In strong uptrends, RSI often treats 40–50 as support; in downtrends, 50–60 acts as resistance.
Here’s the critical nuance beginners miss: overbought does not mean “sell,” and oversold does not mean “buy.” In a powerful uptrend, RSI can sit above 70 for weeks while the stock keeps climbing. Shorting a stock just because RSI crossed 70 is one of the fastest ways to get run over by momentum. RSI describes the pace of the move, not its expiration date.
RSI Divergences: The Signal That Matters Most
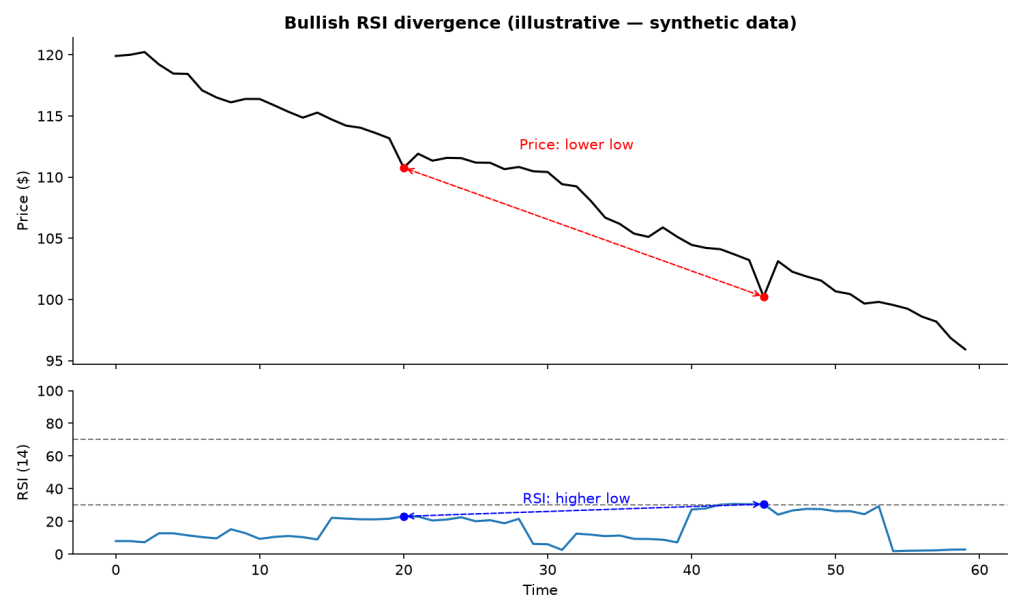
The most respected RSI signal isn’t the level — it’s divergence, when price and RSI disagree:
- Bullish divergence: Price makes a lower low, but RSI makes a higher low. Selling pressure is weakening even though price fell further. Often precedes a bounce.
- Bearish divergence: Price makes a higher high, but RSI makes a lower high. Buying momentum is fading beneath a rising price. Often precedes a pullback.
Divergences don’t predict timing precisely, but they warn that the current move is running on fumes.
RSI Failure Swings
Wilder’s own favorite signal, and one few beginners know:
- A bullish failure swing forms when RSI dips below 30, bounces above 30, pulls back without breaking below its prior low, then breaks above its prior high. It’s a structured way to confirm that selling exhaustion is real.
- The bearish version mirrors it around the 70 level.
Real Examples From Our Scans
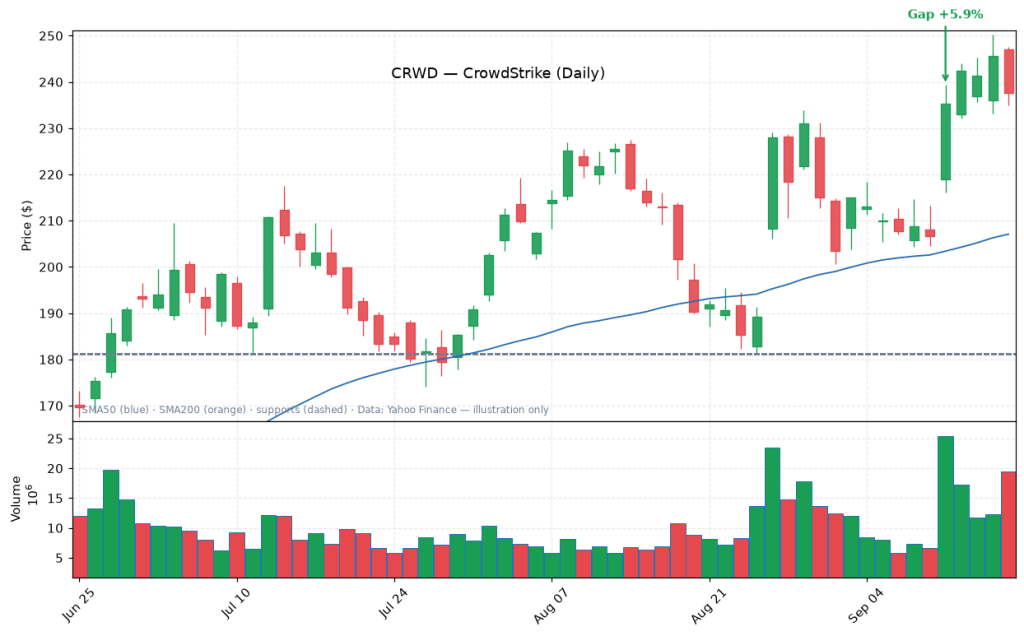
Strong but not overbought — CrowdStrike. In our September 18, 2026 scan, CrowdStrike (CRWD) gapped up +5.9% on 2.2× volume and finished the week up roughly +15% at $237.65 — with a 14-day RSI of 60.4. That’s the lesson in one number: RSI never touched 70, yet the stock ripped. Waiting for “overbought” to fade the move would have meant fighting one of the week’s strongest trends.
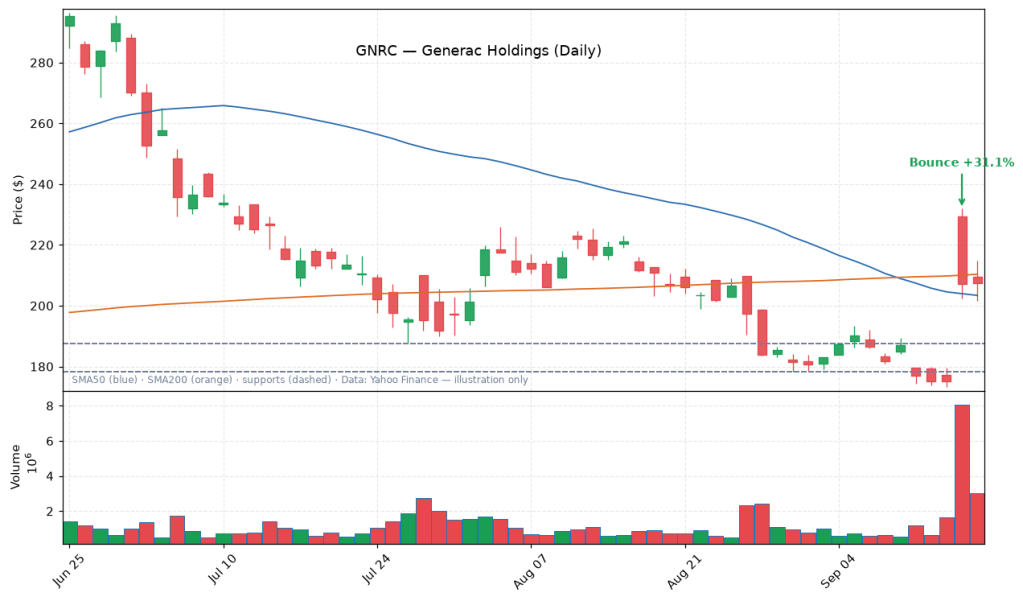
Oversold plus a catalyst — Generac. The same week, Generac (GNRC) was deeply oversold after a long decline — then ripped +18% in a single session on the Amazon data-center news. Oversold alone wasn’t the signal; oversold plus a genuine fundamental catalyst was. That’s exactly why our bounce screen requires both: RSI below 30 (or price 10%+ under the 50-day average) and a violent bounce on 1.5× volume.
Common RSI Mistakes
1. Treating 70/30 as automatic trade signals. In strong trends these levels just confirm strength. Context — trend, volume, price structure — decides what RSI means.
2. Using RSI alone. RSI is a momentum gauge, not a strategy. Pair it with trend filters (like the 200-day moving average) and volume.
3. Wrong timeframe. RSI on a 5-minute chart whipsaws constantly. The 14-day RSI on a daily chart is the standard for swing trading because it smooths out intraday noise.
4. Ignoring the centerline. Many professionals pay more attention to whether RSI holds above 50 in an uptrend than whether it tags 70. Losing 50 in an uptrend is often the earlier, more useful warning.
How We Use RSI in Our Scans
RSI plays two roles in The Gap Up’s weekly screens:
- Gap-up screen: qualifiers need sector-leading or above-average 14-day RSI — we want momentum that’s strong relative to peers, not just a high absolute number.
- Oversold-bounce screen: we look for RSI below 30 at the week’s low (genuinely washed out) combined with a violent bounce on heavy volume. Oversold alone isn’t a buy signal — as Generac’s 18% bounce on the Amazon data-center news showed in our September 18 scan, it’s oversold plus a real catalyst that creates the setup.
Not financial advice. This is educational content about how markets work, not a recommendation to buy or sell any security.
Related: What Is a Gap-Up? · How to Trade Earnings Gaps · This week’s scan

