Category: Guides

  • How to Trade Earnings Gaps: A Beginner’s Framework

    How to Trade Earnings Gaps: A Beginner’s Framework

    Earnings season produces the largest, most violent gaps in the market. A company reports after the close, the numbers surprise Wall Street, and the stock opens 10–20% away from where it closed. These moves are the reason gap trading exists — and the reason most beginners get hurt trying it.

    This guide gives you a framework for thinking about earnings gaps clearly, whether you ever trade one or just want to understand the scans we publish every Friday.

    Why Earnings Cause the Biggest Gaps

    Most news is opinion — an analyst upgrade, a rumor, a sector rotation. Earnings are facts: revenue, profit margins, and forward guidance, released all at once while the market is closed. Every fund manager on earth reads the same numbers overnight and reprices the stock simultaneously. That’s why earnings gaps are bigger and more decisive than news-driven gaps.

    Two things actually move the stock:

    1. The surprise vs. expectations — not whether results were “good,” but whether they beat what was already priced in. A company can grow 30% and still gap down if Wall Street expected 40%.
    2. Forward guidance — what management says about next quarter often matters more than the quarter just reported. A guidance raise on a modest beat gaps harder than a big beat with cautious guidance.

    Before the Report vs. After the Gap

    There are two completely different games:

    Betting before earnings is gambling with extra steps. Options premiums swell before reports (implied volatility crush), so even guessing the direction right can lose money. Most professional gap traders don’t hold through the announcement — they trade the reaction.

    Trading after the gap is the actual strategy: the news is out, the gap exists, and now you’re judging whether the move is real or a head-fake. This is what our weekly scan tracks.

    A Simple Framework: Gap-and-Go vs. Gap Fade

    After an earnings gap, the stock usually does one of two things:

    Gap-and-go (continuation): The stock holds above its opening price, volume stays heavy, and it grinds higher all day. Signs: the gap holds above the prior day’s high, pullbacks are shallow, and each intraday dip gets bought. This is institutional accumulation — funds building positions all session.

    Gap fade (reversal): The stock spikes at the open, then bleeds all day, sometimes closing near where it started — or red. Signs: immediate selling into the open, heavy volume on down moves, loss of the gap-day low. This is distribution — early buyers selling to latecomers.

    The practical rule: don’t decide in the first 15 minutes. Let the opening auction chaos settle. The direction of the first hour’s range break — above the opening range (strength) or below it (weakness) — tells you which scenario is playing out.
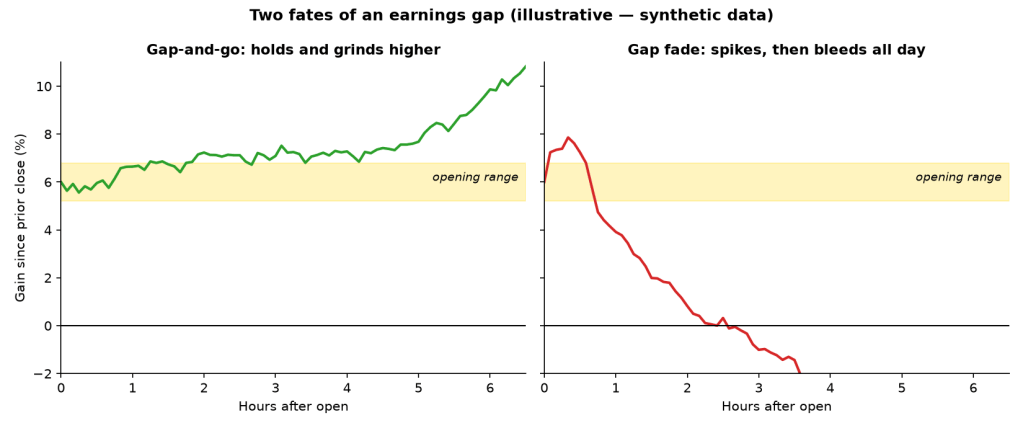
    The two fates of a gap: hold the opening range and grind higher (left), or spike and bleed all day (right). The first hour’s range break usually tells you which one you’re in. (Illustrative diagram, synthetic data.)

    A Worked Example (Illustrative)

    Walk through the framework with a hypothetical — XYZ Corp, a $40B software company:

    • Wednesday 4:05 PM: XYZ reports revenue up 28% vs. 20% expected, and raises next-quarter guidance. Genuine double-beat.
    • Thursday 9:30 AM: XYZ opens at $112, up +12% from Wednesday’s $100 close, on 3× average premarket volume.
    • 9:30–10:30 AM: The stock chops between $110 and $114 — the opening range. You do nothing; this is the amateur hour.
    • 10:45 AM: XYZ breaks above $114 on rising volume. That’s your signal: this is gap-and-go, not a fade. A disciplined entry goes above the opening-range high with a stop just under $110 (the bottom of the range, near the gap-day low).
    • The alternative: if XYZ had instead broken below $110 by 10:30 AM on heavy selling, the trade is off — no entry, no hoping. The gap failed; the framework kept you out.

    Notice what the framework never does: it never chases the 9:31 AM spike, never buys without a stop, and never confuses “great earnings” with “safe entry.” The numbers here are fictional, but the decision tree is exactly how professional gap traders operate.

    Risk Management: The Rules That Keep You Alive

    Earnings gaps are volatile enough to hurt. Non-negotiable rules:

    • Position size small. A 15% gap can reverse 10% intraday. Size positions so a full stop-out costs no more than 1–2% of your account.
    • Stop below the gap-day low. If the stock trades back below where the gap started, your thesis is broken. Exit — don’t hope.
    • Never average down on a fading gap. Adding to a gap that’s filling is catching a falling knife with leverage.
    • Take partial profits into strength. If you’re up 8% on a gap-and-go by midday, banking half locks in the win and lets the rest run risk-free.
    • Avoid holding through the next catalyst. A gap-up into an upcoming Fed meeting or competitor’s earnings is borrowed time.

    What History Says About Holding Gaps

    The honest answer: it depends on the kind of gap. Breakaway gaps on genuine earnings surprises in market leaders have historically been the highest-probability continuation setups in swing trading — that’s the entire premise of momentum strategies. But most gaps are common gaps that fill within days, and chasing them at the open after a 15% pop is how beginners buy tops.

    Our approach at The Gap Up: we don’t predict. We scan for gaps that meet strict quality filters (large-cap, 3%+ gap, heavy volume, above the 200-day average), then we grade whether they held through Friday — and publish the scorecard, wins and losses alike. The September 18 scan is a good example: seven gap-ups, all news-driven, each tracked through the week.

    Common Mistakes

    Chasing the open. The worst fills of the day go to market orders placed at 9:31 AM. Wait for the range to establish.

    Confusing a good company with a good gap. Great businesses gap down on earnings too. Trade the price action, not your opinion of the company.

    Ignoring the broader market. A stock gapping up into a market selloff faces a headwind all day. Check what the S&P 500 is doing before trusting any single-name signal.

    No exit plan. Every gap trade needs three prices written down before entry: where you’re wrong (stop), where you take profit, and where you reassess (usually the first hour’s range).


    Not financial advice. This is educational content about how markets work, not a recommendation to buy or sell any security.

    Related: What Is a Gap-Up? · RSI Explained · This week’s scan

  • RSI Explained: How Traders Actually Use the Relative Strength Index

    RSI Explained: How Traders Actually Use the Relative Strength Index

    The Relative Strength Index (RSI) is a momentum indicator that measures how fast and how far a stock’s price has been moving. It was developed by J. Welles Wilder Jr. and introduced in his 1978 book New Concepts in Technical Trading Systems. Nearly fifty years later, it’s still one of the most widely used indicators in trading.

    RSI oscillates between 0 and 100. High readings mean buyers have been aggressive; low readings mean sellers have dominated. That’s it — everything else is interpretation.

    How RSI Is Calculated (The Simple Version)

    You don’t need the formula to use RSI, but knowing the intuition helps:

    1. Look at the last 14 periods (usually 14 days on a daily chart — the standard setting).
    2. Add up the gains on up days and the losses on down days separately.
    3. RSI compares the average gain to the average loss.

    If the average gain dwarfs the average loss, RSI pushes toward 100. If losses dominate, it sinks toward 0. An RSI of 50 means gains and losses are roughly balanced.

    The precise formula is RSI = 100 − [100 / (1 + RS)], where RS = average gain / average loss. Every charting platform — including TradingView — calculates it for you automatically.

    Reading the Levels: 70, 30, and 50

    The classic interpretation:

    • Above 70 — “overbought.” Buying has been intense. The move may be stretched.
    • Below 30 — “oversold.” Selling has been intense. The decline may be exhausted.
    • 50 — the centerline. Above 50, bulls have the edge; below 50, bears do. In strong uptrends, RSI often treats 40–50 as support; in downtrends, 50–60 acts as resistance.

    Here’s the critical nuance beginners miss: overbought does not mean “sell,” and oversold does not mean “buy.” In a powerful uptrend, RSI can sit above 70 for weeks while the stock keeps climbing. Shorting a stock just because RSI crossed 70 is one of the fastest ways to get run over by momentum. RSI describes the pace of the move, not its expiration date.

    RSI Divergences: The Signal That Matters Most

    The most respected RSI signal isn’t the level — it’s divergence, when price and RSI disagree:

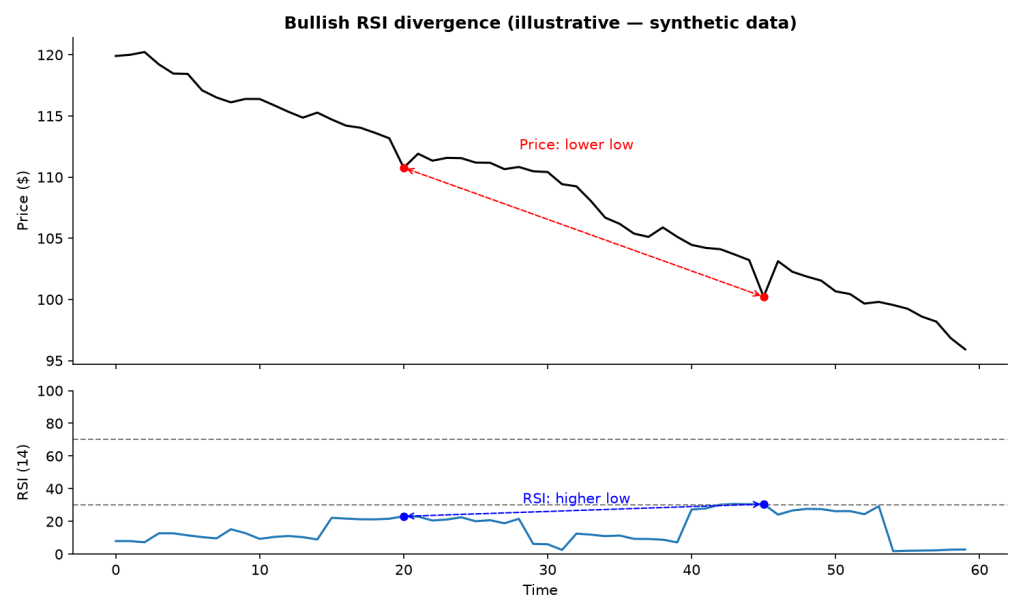
    • Bullish divergence: Price makes a lower low, but RSI makes a higher low. Selling pressure is weakening even though price fell further. Often precedes a bounce.
    • Bearish divergence: Price makes a higher high, but RSI makes a lower high. Buying momentum is fading beneath a rising price. Often precedes a pullback.

    Divergences don’t predict timing precisely, but they warn that the current move is running on fumes.

    Bullish divergence: price pushes to a lower low, but RSI refuses to follow — selling pressure is weakening underneath. (Illustrative diagram, synthetic data.)

    RSI Failure Swings

    Wilder’s own favorite signal, and one few beginners know:

    • A bullish failure swing forms when RSI dips below 30, bounces above 30, pulls back without breaking below its prior low, then breaks above its prior high. It’s a structured way to confirm that selling exhaustion is real.
    • The bearish version mirrors it around the 70 level.

    Real Examples From Our Scans

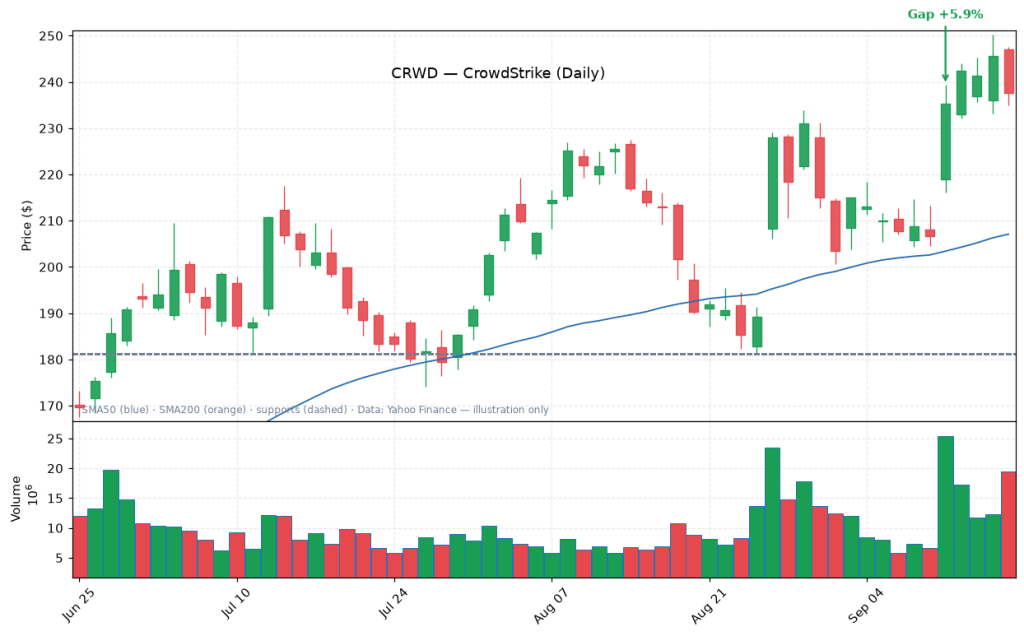
    Strong but not overbought — CrowdStrike. In our September 18, 2026 scan, CrowdStrike (CRWD) gapped up +5.9% on 2.2× volume and finished the week up roughly +15% at $237.65 — with a 14-day RSI of 60.4. That’s the lesson in one number: RSI never touched 70, yet the stock ripped. Waiting for “overbought” to fade the move would have meant fighting one of the week’s strongest trends.

    CRWD’s RSI sat at 60.4 — strong momentum, nowhere near overbought. Real chart from our September 18 scan.

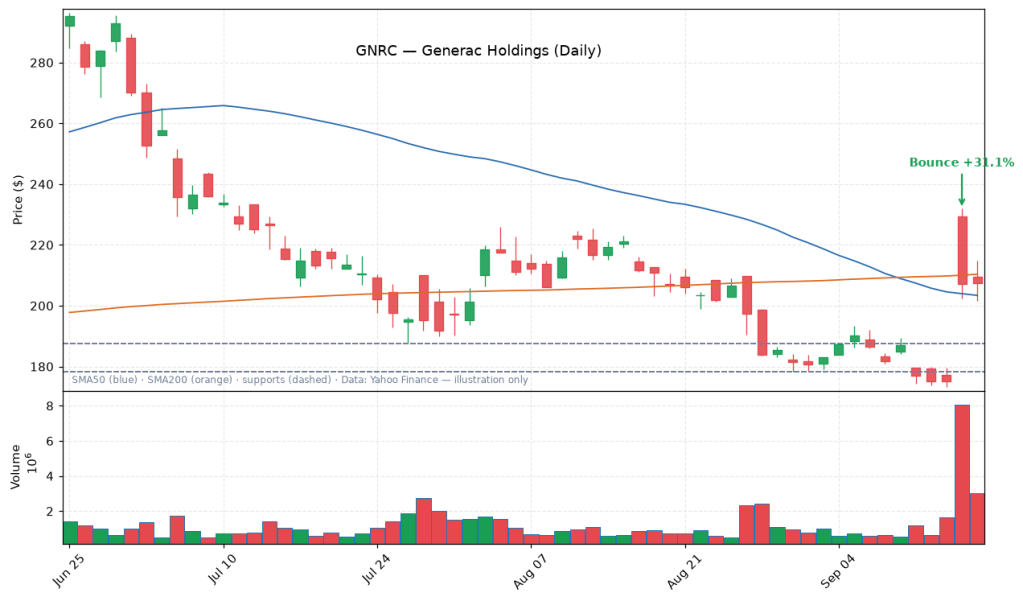
    Oversold plus a catalyst — Generac. The same week, Generac (GNRC) was deeply oversold after a long decline — then ripped +18% in a single session on the Amazon data-center news. Oversold alone wasn’t the signal; oversold plus a genuine fundamental catalyst was. That’s exactly why our bounce screen requires both: RSI below 30 (or price 10%+ under the 50-day average) and a violent bounce on 1.5× volume.

    GNRC: washed out, then +18% on real news. Oversold needs a catalyst. Real chart from our September 18 scan.

    Common RSI Mistakes

    1. Treating 70/30 as automatic trade signals. In strong trends these levels just confirm strength. Context — trend, volume, price structure — decides what RSI means.

    2. Using RSI alone. RSI is a momentum gauge, not a strategy. Pair it with trend filters (like the 200-day moving average) and volume.

    3. Wrong timeframe. RSI on a 5-minute chart whipsaws constantly. The 14-day RSI on a daily chart is the standard for swing trading because it smooths out intraday noise.

    4. Ignoring the centerline. Many professionals pay more attention to whether RSI holds above 50 in an uptrend than whether it tags 70. Losing 50 in an uptrend is often the earlier, more useful warning.

    How We Use RSI in Our Scans

    RSI plays two roles in The Gap Up’s weekly screens:

    • Gap-up screen: qualifiers need sector-leading or above-average 14-day RSI — we want momentum that’s strong relative to peers, not just a high absolute number.
    • Oversold-bounce screen: we look for RSI below 30 at the week’s low (genuinely washed out) combined with a violent bounce on heavy volume. Oversold alone isn’t a buy signal — as Generac’s 18% bounce on the Amazon data-center news showed in our September 18 scan, it’s oversold plus a real catalyst that creates the setup.

    Not financial advice. This is educational content about how markets work, not a recommendation to buy or sell any security.

    Related: What Is a Gap-Up? · How to Trade Earnings Gaps · This week’s scan

  • What Is a Gap-Up? The Complete Beginner’s Guide

    What Is a Gap-Up? The Complete Beginner’s Guide

    Illustration of a stock price chart showing a gap-up between trading sessions

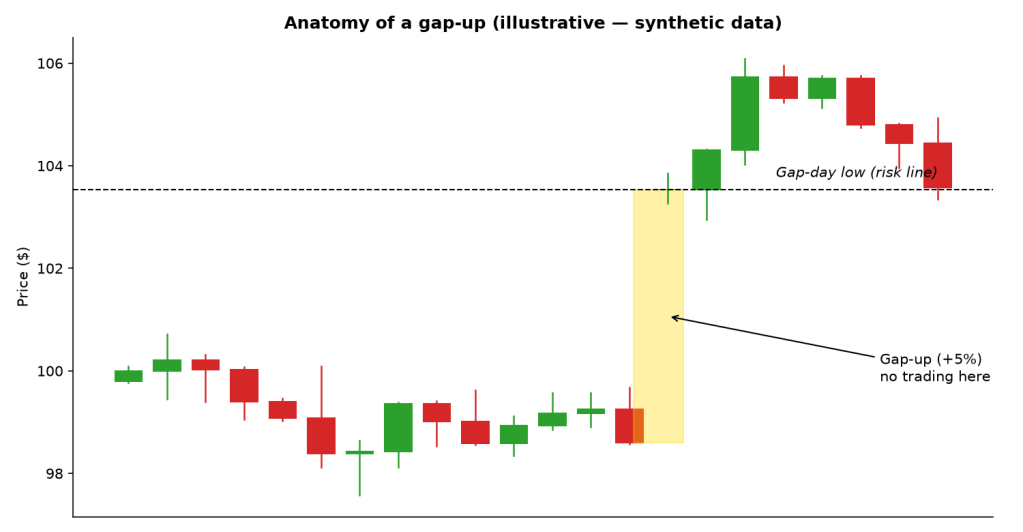
    A gap-up is when a stock opens the trading day meaningfully higher than where it closed the day before — leaving a visible “gap” on the price chart where no trading happened. If a stock closes at $100 and opens the next morning at $105, that’s a 5% gap-up.

    Gaps matter because they reveal urgency. Someone — usually a lot of someones — got news overnight and decided they couldn’t wait for the opening bell to buy.

    Anatomy of a gap-up: the shaded zone is where no trading happened. The gap-day low becomes the line in the sand — if price falls back below it, the gap has failed. (Illustrative diagram, synthetic data.)

    Why Do Stocks Gap Up?

    Most trading happens between 9:30 AM and 4:00 PM Eastern. But news doesn’t keep market hours. When material news breaks overnight or before the open, buy and sell orders pile up, and the opening price jumps to wherever supply meets demand. Common triggers include:

    • Earnings reports — released after the close or before the open, the single most common cause of large gaps
    • Guidance raises — a company telling Wall Street the future looks better than expected
    • Analyst upgrades — a major bank raising its rating or price target
    • M&A news — buyout offers and mergers
    • Sector rotation — money flowing into an entire industry at once (like cybersecurity on September 14, 2026, when CrowdStrike, Zscaler, and Fortinet all gapped up the same morning)
    • Macro news — Fed decisions, jobs data, or geopolitical developments

    The 4 Types of Gaps

    Not all gaps are created equal. Technical analysts traditionally classify them four ways:

    1. Common gaps — Small, low-volume gaps in choppy or sideways markets. They usually fill within days and carry little information. This is noise.

    2. Breakaway gaps — A stock breaks out of a trading range or consolidation pattern on heavy volume. These are the gaps that start real moves, because they mark a genuine shift in supply and demand.

    3. Runaway (continuation) gaps — Gaps that appear in the middle of an already-strong trend, signaling the trend has further to go. Often driven by renewed conviction after new information.

    4. Exhaustion gaps — A sharp gap near the end of a long advance, often on extreme volume and euphoric news. These can mark the top — everyone who wanted to buy just did.

    Telling them apart in real time is the hard part, which is why confirmation matters more than classification.

    What Makes a Gap-Up Worth Watching?

    At The Gap Up, we don’t chase every gap. Our weekly scan only flags gaps that clear strict quality filters:

    • Size: at least 3%. Smaller opening moves are noise — they fill too easily to mean anything.
    • Large-cap only (over $10B market cap). Small caps gap on thin volume and reverse violently. Large caps need real money to move.
    • Heavy volume. A gap on 2x average volume means institutions participated. A gap on thin volume is just a quote with no conviction behind it.
    • Above the 200-day moving average. We want stocks already in long-term uptrends — gaps that continue strength, not dead-cat bounces.
    • It has to hold. The real test isn’t the open — it’s Friday. A gap that stays above its gap-day low all week is strength. One that fades by lunchtime was a trap.

    Real Example: ARM’s September 17 Gap

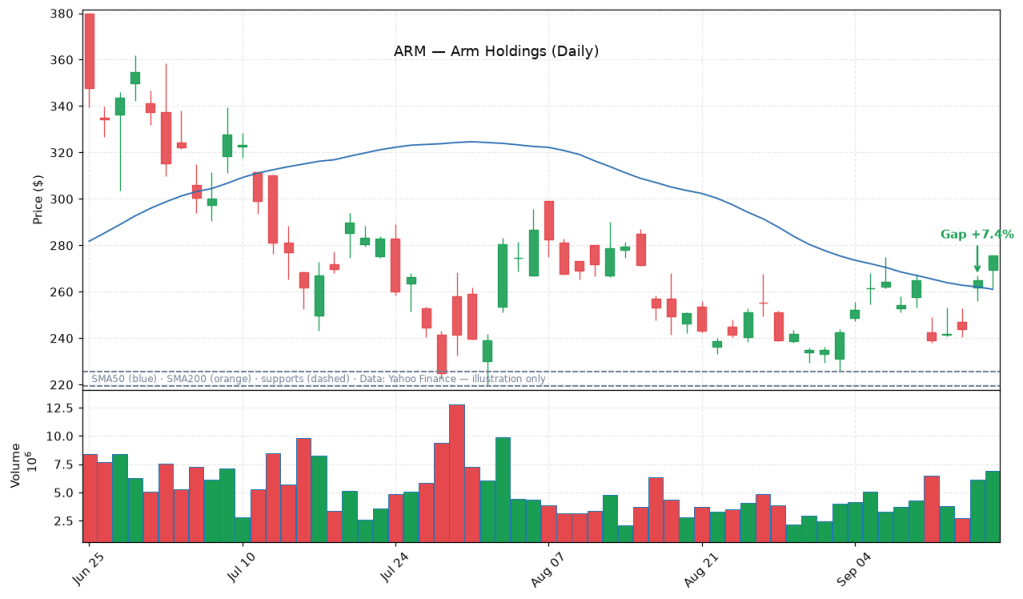
    On September 17, 2026, Arm Holdings (ARM) opened +7.4% above its prior close — a textbook gap-up on 1.6× average volume. Here’s how it scored against the checklist:

    • Size: +7.4% — well above the 3% noise threshold ✓
    • Volume: 1.6× average — real institutional participation ✓
    • Held: it stayed above its gap-day low all week and closed Friday at $275.61, up +4.1% for the week ✓
    • Momentum: 14-day RSI of 57.7 — strong, but not stretched into overbought territory ✓

    This is what a healthy gap looks like: real news, real volume, and buyers defending the gap all week instead of selling into it. (From our September 18 weekly scan.)

    ARM’s gap-up held into Friday — the kind of follow-through that separates signal from noise. Real chart from our September 18 scan.

    Gaps That Fail: The Bull Trap

    Here’s what beginners miss: most gaps partially or fully “fill” — meaning the price drifts back down to where the gap started. A stock that gaps up 5% at the open and closes up 1% showed you everything: early urgency, then selling into strength.

    The classic bull trap pattern:

    1. Big gap-up on exciting news
    2. Retail buyers chase the open
    3. Early buyers (who bought the news before you saw it) sell into the rally
    4. Price fades all day, sometimes closing red

    This is why chasing a gap at the open is one of the most reliable ways beginners lose money. The professionals who bought overnight are often selling to the crowd arriving at 9:35 AM.

    How We Track Gap-Ups at The Gap Up

    Every Friday after the close, we run a systematic scan of the week’s gap-ups through the filters above and publish the qualifiers — with annotated charts, the catalyst behind each move, and an honest accounting of whether prior weeks’ picks held up. Stocks that almost made it get their own near-misses post, with the exact filter each one failed.

    Frequently Asked Questions

    Do gaps always get filled?

    No — that’s a myth. Common gaps usually fill quickly, but breakaway gaps in strong trends can go months without filling. The “gaps always fill” rule causes traders to short strong breakouts and get run over.

    Can you trade a gap-up before the market opens?

    Premarket trading exists, but spreads are wide, volume is thin, and prices are volatile. Most beginners should wait for the regular session.

    What’s the difference between a gap-up and just a big green day?

    A big green day rallies during market hours. A gap-up opens higher — the move happened while the market was closed, which signals overnight urgency rather than intraday momentum.

    Is a gap-up always bullish?

    Short-term, yes — it shows buying pressure. But exhaustion gaps near the top of a long rally can mark the end of a move, not the beginning.


    Not financial advice. This is educational content about how markets work, not a recommendation to buy or sell any security.

    Related: How to Trade Earnings Gaps · RSI Explained · This week’s scan